DOING BUSINESS
Workforce Data
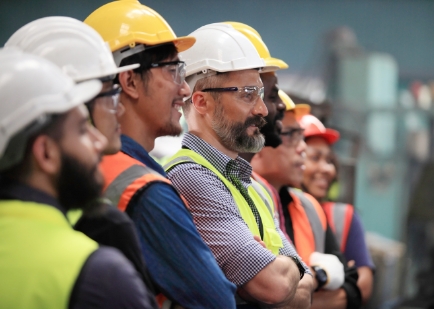
The Greater Bridgeport Area’s well-educated population means a strong availability of skilled labor. Additionally, more than 1,000 service members exit Connecticut’s military installations every year and are looking to join the workforce in their field of training.
Labor Force By the Numbers
| Greater Bridgeport Area |
Fairfield County, CT |
Connecticut | U.S. | |
|---|---|---|---|---|
| Labor Force | 189,868 | 571,389 | 2,019,902 | 171,035,000 |
| Employed | 183,591 | 549,587 | 1,930,651 | 163,288,000 |
| Unemployed | 8,491 | 21,339 | 80,035 | 7,747,000 |
| Unemployment Rate | 3.6% | 3.7% | 3.9% | 4.5% |
Source: Esri 2025
Education ATTAINMENT

| With college experience | 72.8% |
|---|---|
| With graduate degrees | 25.1% |
| With bachelor’s degrees | 28.1% |
| With associate degrees or some college | 19.5% |
| With high school-only experience | 19.8% |
Source: Esri 2025
MEDIAN Weekly Wage
$1,070
Source: Esri 2025
WORKFORCE By Age
-
24.6
<19
-
12.3
20-29
-
12.0
30-39
-
12.9
40-49
-
21.2
50-64
-
16.8
65>
Source: Esri 2025
Employment BY INDUSTRY


| Management & Office | 26.6% |
|---|---|
| Healthcare | 7.7% |
| Sales | 10.2% |
| Education & Legal | 5.7% |
| Maintenance & Repair | 2.5% |
| Other Service Occupations | 7.2% |
| Hospitality & Food | 4.3% |
| Business & Finance | 9.7% |
| Transportation & Material Moving | 5.6% |
| Math, Science & Engineering | 5.8% |
| Manufacturing & Production | 4.8% |
| Construction & Extraction | 3.8% |
| Arts, Design, Entertainment, Sports, Media | 5.9% |
| Military-only Occupations | 0.2% |
| Farming, Fishing, Forestry | 0.1% |
Source: Esri 2025
Target Industries
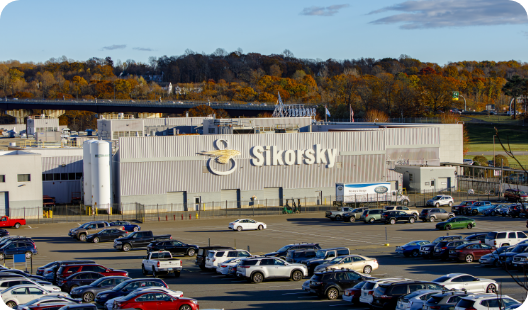
Aerospace Manufacturing

Medical Device Manufacturing

Intermediate Parts Manufacturing

Consumables Manufacturing
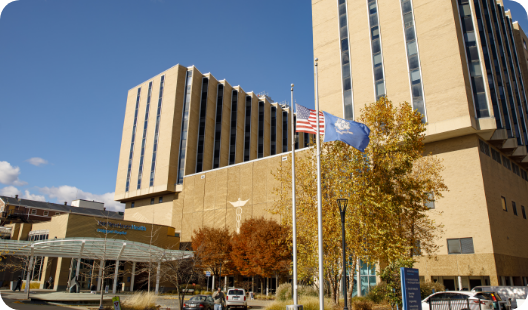
Healthcare